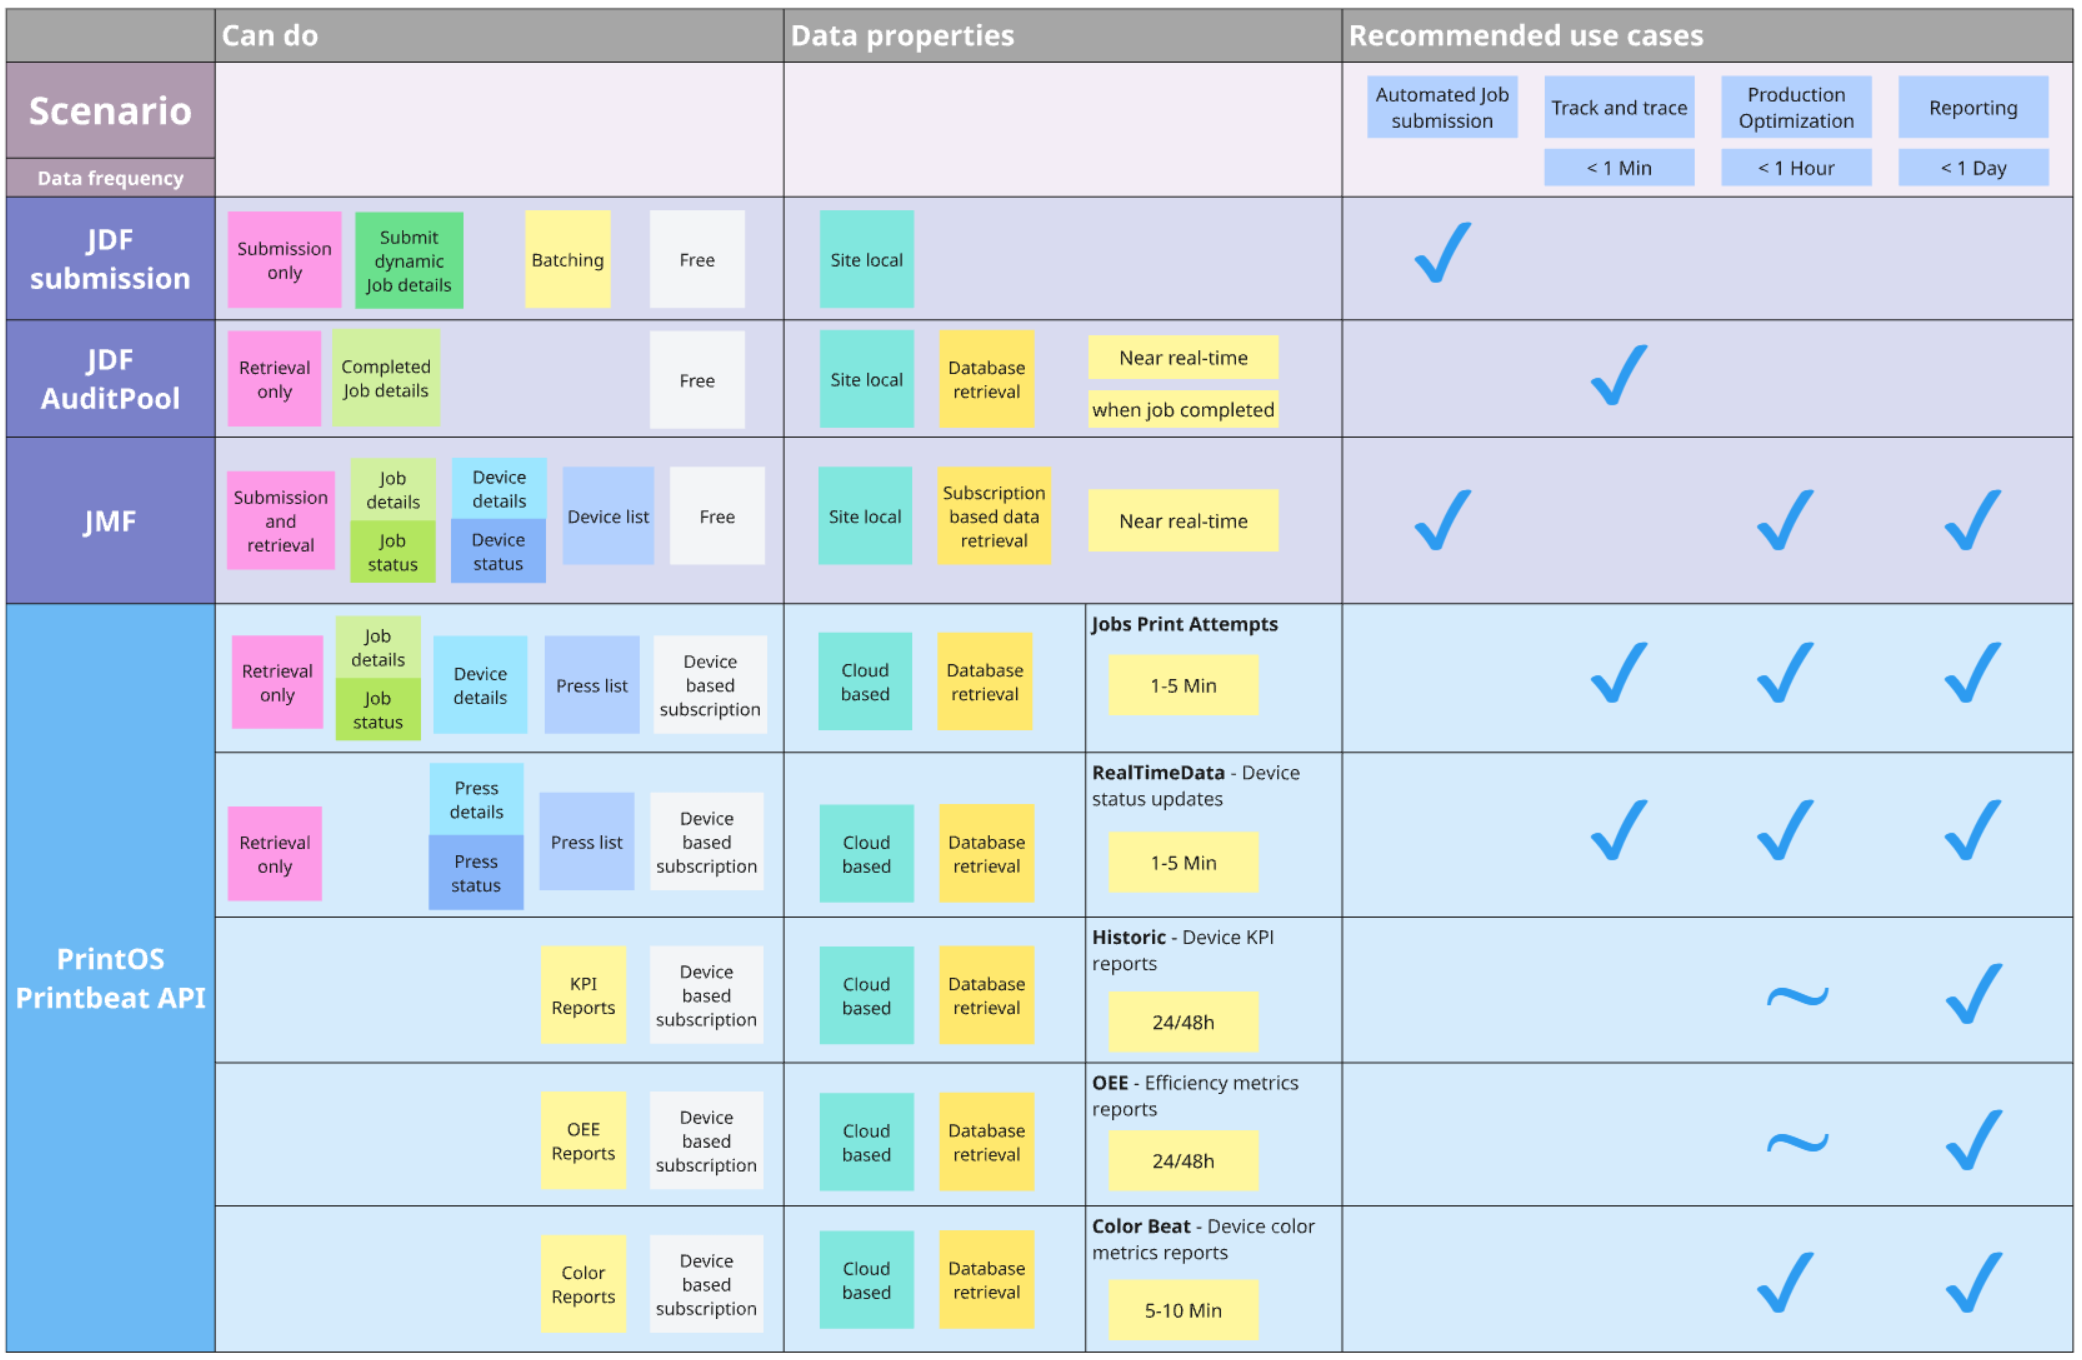
How to read this overview chart
For practical purposes we divide, very roughly, the use cases for integration in three scenario categories. For each category we have determined a minimal data refresh frequency that is needed to make the most common scenarios in this category feasible.
✔ Means that the integration tool can cover the data and frequency requirements in this category.
~ Symbol means "about", means that the integration tool can mostly cover the data and frequency requirements in this category.
| Scenario category | Update frequency |
|---|---|
|
Track and Trace - Scenarios that deal with constant monitoring of jobs and devices, often to inform upstream MIS or production management systems or to integrate with other solutions that require high frequency monitoring. | once per minute or less |
| Production Optimization - scenarios that deal with semi-live monitoring and optimization of productivity, uptime, efficiency or waste. Scenarios that need fresh data no more than once per shift or a few times per day. | once per hour or less |
| Reporting - Scenarios that deal with ad hoc reporting or recurring reporting for logistical, commercial or analytical purposes. Scenarios that need data on a weekly, monthly, quarterly or yearly basis. | once per day or less |
| Common terms | |
| Real time - not a frequency term but an immediacy term, meaning virtually instantaneous | less than a second |
| Near real time - not a frequency term but an immediacy term, meaning within a few seconds | less than a few seconds |
| Current - update frequency commonly used by Print Beat API and Jobs API | every 1-5 minutes |